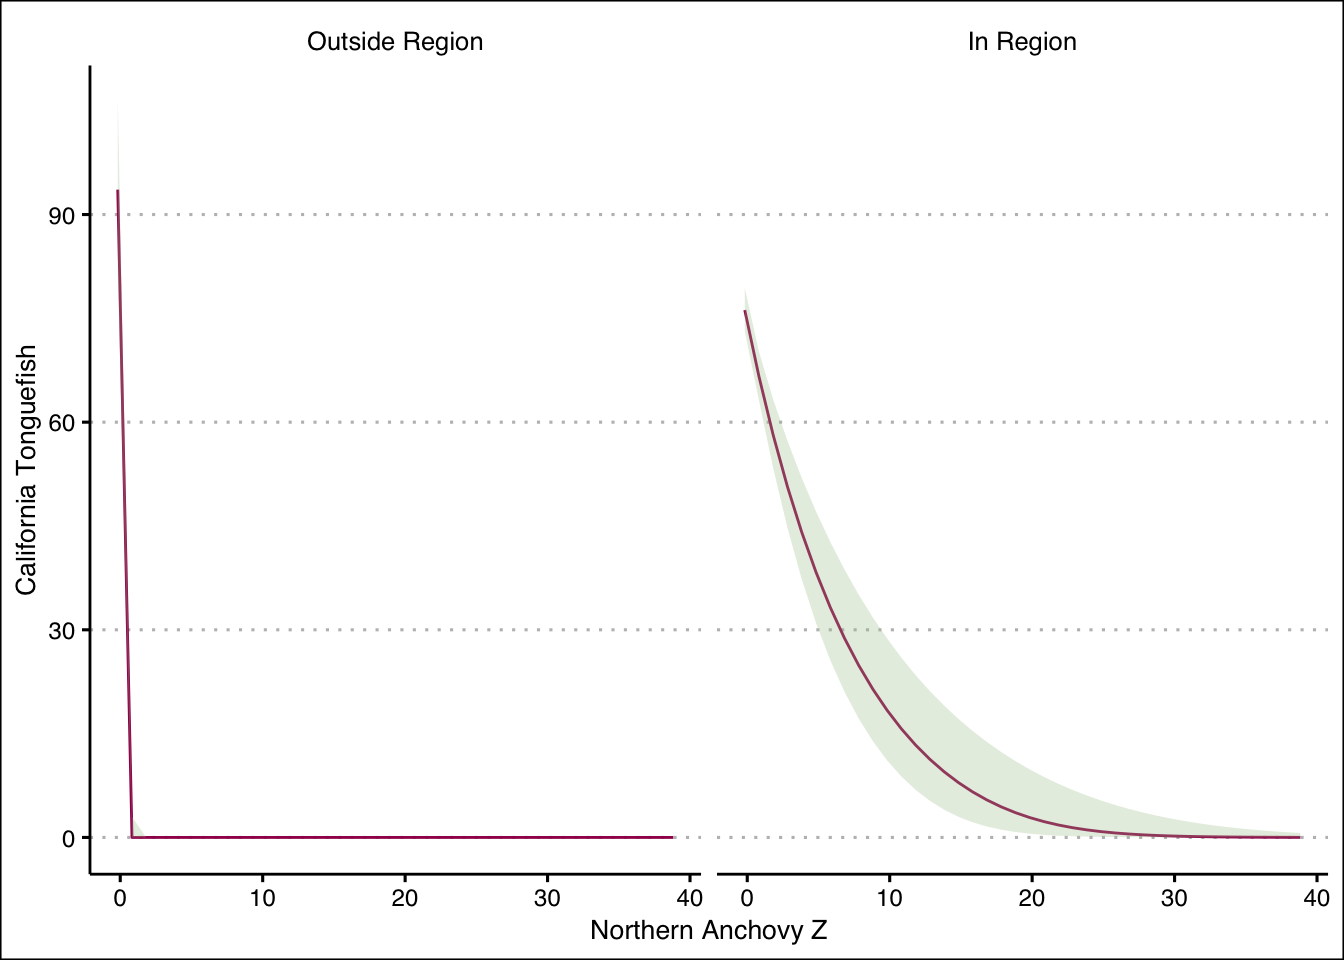
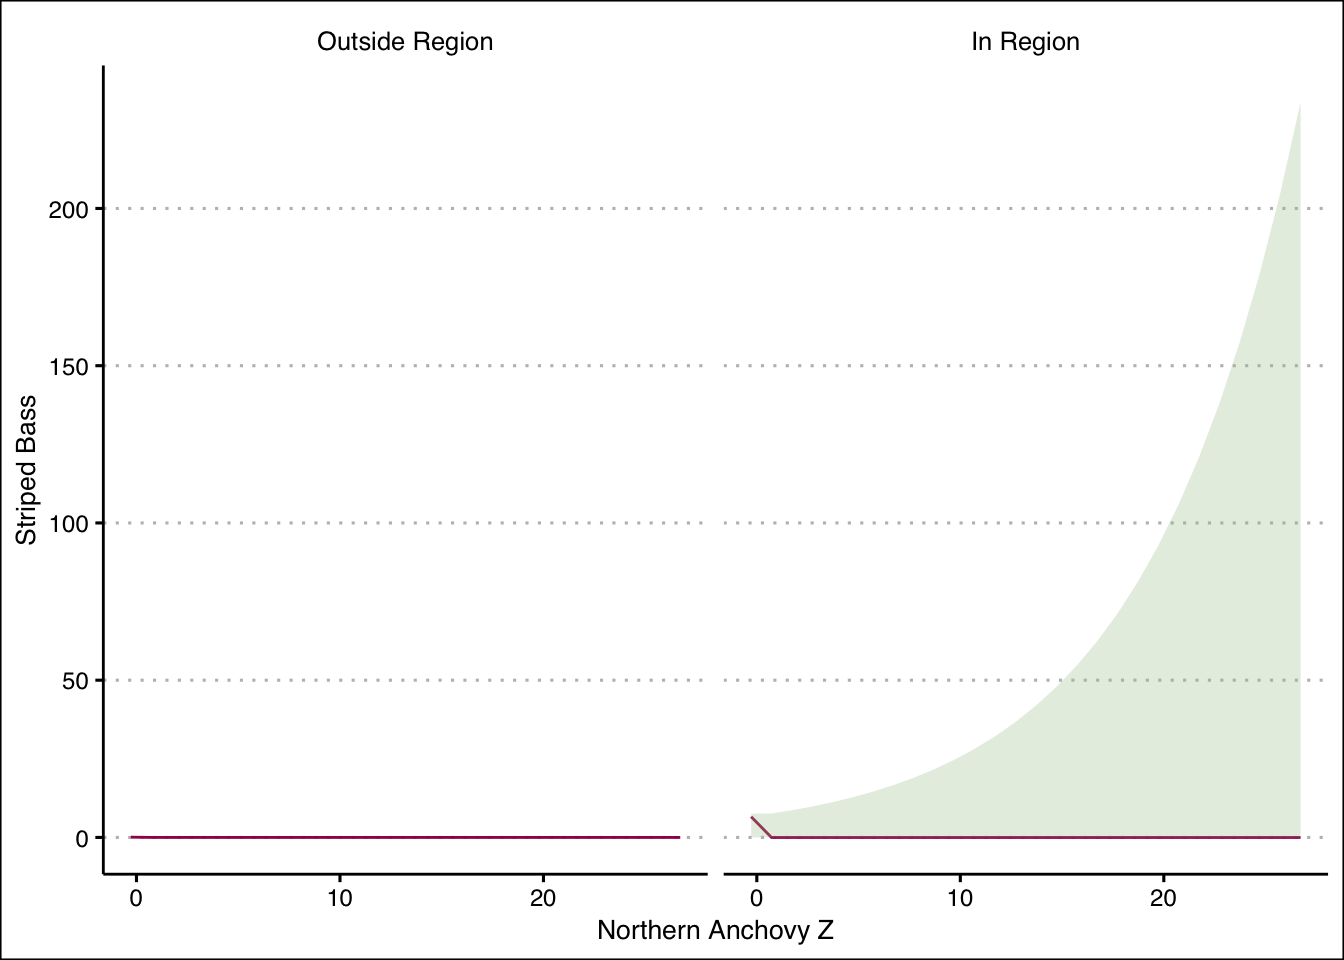
The San Francisco Bay is a large estuarine bay in Northern California which spans 60 miles (Britannica, n.d.). The San Francisco Estuary is the largest estuary in California, with rivers from the ridgeline of the Sierra Nevada mountains leading to the strait of the Golden Gate, including almost 60,000 square miles and nearly 40% of California (Partnership, n.d.). As of 2002, San Francisco Bay sustains nearly 500 species of fish, invertebrates, birds, mammals, insects and amphibians. It is an essential resting place, feeding area, and wintering ground for millions of birds on the Pacific Flyway. Nearly half of the state’s waterfowl and shorebirds and two-third of the state’s salmon pass through the Bay during their migrations (Conservation and Commission 2002).
In recent years harmful algal blooms (HABs) have decimated many populations in the bay. HABs are becoming more frequent and more intense across California as waters warm. Decreased flows from inland rivers and streams, and increased concentrations of nutrients and other land-based pollutants additionally exacerbate the growth of algae and cyanotoxins (Council 2022).
When monitoring the bay, it is often difficult to monitor less populated species to the extent of more frequent species. To combat this in this project I will be comparing populations of Northern Anchovy, the most populous species in the bay, to that of other more niche species. For example while we might catch thousands of Northern Anchovy in a season, there may be only one or two Tonguefish.
This project is organized in this way:
Directed Acyclic Graph
Data import and preliminary analysis
Indicator species analysis
Simulate data to test Hurdle model validity
Create function for Hurdle model
Call function on indicator species in the four regions of the bay:
South Bay
Central Bay
San Pablo Bay
Suisun Bay
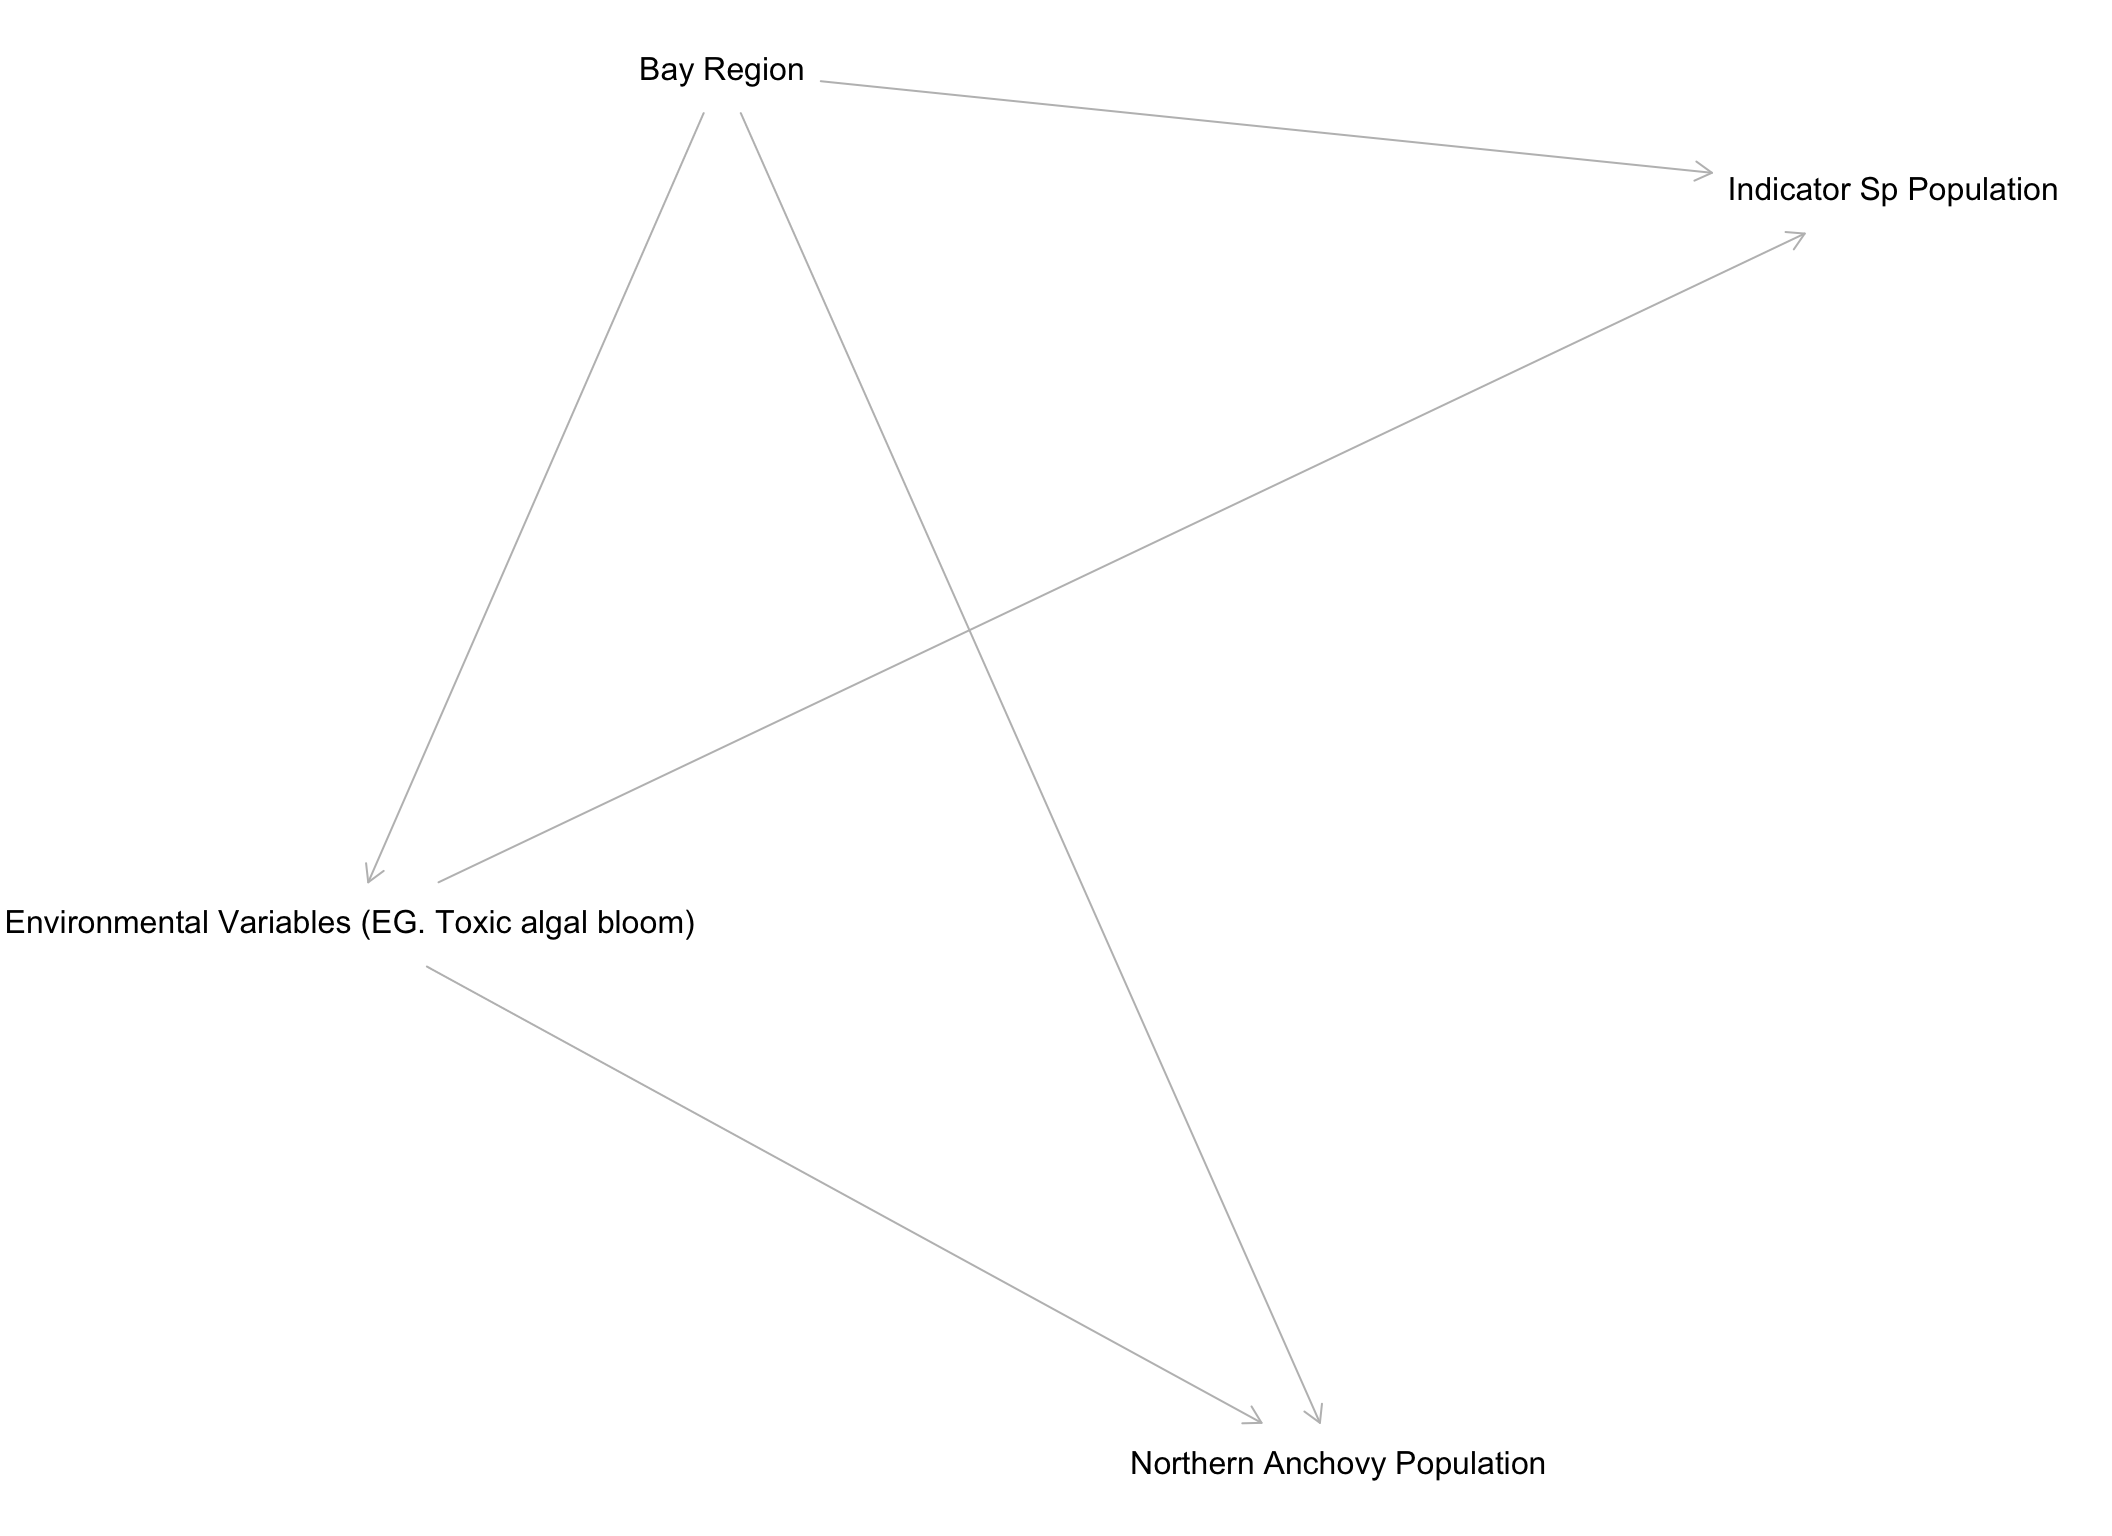
DAG
This analysis is predicated on the same environmental factors effecting Northern Anchovies and other species at similar levels. This leads to a DAG which looks like this:
First we import data which was requested from (Institute n.d.). This data encapsulates individual otter trawls which were taken in the Bay between 1972 and 2017. The net is kept in the water for 5 minutes and then retrieved. A majority of the trawls are taken in the South Bay, however there are consistent year over year trawls in the other regions (Central bay, San Pablo bay, and Suisun bay).
Code
# Raw catch datacatch_raw <-read_csv(here::here('posts', 'sf_bay_catches', 'data', 'catch_9218.csv'))# For easy reference we also import species key species_key <-read_csv(here::here('posts', 'sf_bay_catches','data', 'species_key.csv'), col_names =FALSE)
Now we can clean up the messy dataset and make a functional species key
Code
# The species key has some very difficult first columns so we need to restrict it down to just species code and namespecies_key_clean <- species_key[c(4,5),3:125] %>%row_to_names(row_number =1) %>%clean_names() %>%remove_empty(which ="rows") %>%pivot_longer(cols =everything(),names_to ='species_code', values_to ='species_name')%>%mutate(species_code =str_to_upper(species_code),species_name =str_to_title(str_to_lower(species_name)))species_key_clean %>%kable( format ="html", digits =3,caption ="Species Key") %>%kable_styling(bootstrap_options =c("striped", "hover", "condensed", "responsive"),full_width =FALSE,position ="center",font_size =14 ) %>%row_spec(0, bold =TRUE, color ="white", background ="#A0185A") %>%# headerrow_spec(1:nrow(species_key_clean), color ="black", background ="#FFC4EB") %>%scroll_box(width ="300px", height ="600px")
Species Key
species_code
species_name
AG
Arrow Goby
AS
American Shad
BBC
Brown Bullhead Catfish
BG
Bay Goby
BHS
Bonyhead Sculpin
BOC
Bocaccio Rockfish
BP
Black Perch
BPF
Bay Pipefish
BR
Bat Ray
BRF
Bolinas Rockfish
BRO
Brown Rockfish
BS
Brown Smoothhound
BSC
Buffalo Sculpin
BSF
Blacktail Snailfish
BSK
Big Skate
BSP
Barred Surfperch
CAL
Calico Surfperch
CBZ
Cabezon
CG
Chameleon Goby
CH
California Halibut
CLF
California Lizardfish
COT
C-O Turbot
CRF
Copper Rockfish
CRL
Curlfin Turbot
CSG
Cheekspot Goby
CT
California Tonguefish
DS
Dover Sole
DSP
Dwarf Surfperch
DT
Diamond Turbot
EP
Eel Pout
ES
English Sole
GBY
Goby Sp.
GRF
Grass Rockfish
GRU
Calif (Silverside) Grunion
GS
Green Sturgeon
HB
Halibut Sp.
HH
Hornyhead Turbot
HMP
Half Moon Perch
JS
Jacksmelt
KF
Kelp Fish
KG
Kelp Greenling
KP
Kelp Pipefish
KS
King Salmon
LC
Ling Cod
LFS
Longfin Smelt
LS
Leopard Shark
LSD
Longfin Sanddab
MFE
Monkey Face Eel
MS
Mudsucker
NA
Northern Anchovy
NEW
NA
NMS
Northern Midshipman
NS
Night Smelt
PB
Pacific Butterfish
PEN
Penpoint Gunnel
PER
Pacific Electric Ray
PH
Pacific Herring
PHB
Pacific Halibut
PL
Pacific Lamprey
PM
Pacific Mackerel
PMS
Plainfin Midshipman
POM
Pompano
PP
Prickleback
PS
Pacific Sardine
PSD
Pacific Sanddab
PSP
Pile Surfperch
PT
Pacific Tomcod
RED
Redtail Surfperch
RF
Rockfish
RH
Round Herring
RL
Red Irish Lord
RP
Reef Perch
RS
Rex Sole
RSP
Rainbow Surfperch
RUB
Rubberlip Surfperch
SAL
Salmon Species
SB
Striped Bass
SBG
Saddleback Gunnel
SC
Sculpin Sp.
SCA
Scalyfin Sole
SD
Sanddab Sp.
SDF
Spiny Dogfish
SF
Starry Flounder
SFS
Spotfin Surfperch
SGF
Shovelnose Guitarfish
SGS
Sevengill Shark
SH
Unidentified Shad
SHI
Shimofuri Goby
SHO
Shokihaze Gobi
SHS
Staghorn Sculpin
SIL
Silver Surfperch
SIS
Silverside
SKF
Spotted Kelpfish
SM
Smelt Sp.
SMS
Specked Fin Midshipman
SN
Snailfish Sp.
SPT
Spotted Turbot
SS
Sand Sole
SSD
Speckled Sanddab
SSN
Showy Snailfish
SSP
Shiner Surfperch
STU
Sturgeon Species
SUR
Surf Smelt
TC
Tomcod
TFS
Threadfin Shad
THS
Thorny Sculpin
TP
Tule Perch
TPS
Tidepool Sculpin
TR
Thornback Ray
TS
Topsmelt
TSS
Three Spine Stickleback
UG
Unknown Goby Species
UMS
Unidentified Midshipman
US
Unknown Sole Species
USP
Surfperch, Species Unknown
WBS
Whitebait Smelt
WC
White Croaker
WHS
White Surfperch
WS
White Sturgeon
WSB
White Seabass
WSP
Walleye Surfperch
YG
Yellowfin Goby
YR
Yellowtail Rockfish
Code
# The catch data is much cleaner, all we need is a quick clean namescatch_clean <- catch_raw %>%clean_names()catch_clean$species_code[is.na(catch_clean$species_code)] <-'NA'catch_clean %>%head(100) %>%kable( format ="html", digits =3,caption = tags$caption("100 Rows of Catch Data",style ="caption-side: top; text-align: left; font-weight: bold; color: #A0185A; font-size: 16px;" )) %>%kable_styling(bootstrap_options =c("striped", "hover", "condensed", "responsive"),full_width =FALSE,position ="left",font_size =14 ) %>%row_spec(0, bold =TRUE, color ="white", background ="#A0185A") %>%# headerscroll_box(width ="800px", height ="300px")
100 Rows of Catch Data
catch_info_trawl_id
species_code
size
class
number
sex
trawl_map_trawl_id
locale
trawl_map_training_trawl
trawl_map_data_audit
expr1
expr2
trawl_info_trawl_id
hydro_id
scientists
intern
date
school
trawl_time_begin
trawl_time_end
trawl_time_total
depth_of_trawl
tidal_current
last_slack_time
last_slack_tide
last_slack_height
sample_station
water_type
substrate
net_drag_bottom
line_length
start_latitude
start_longitude
end_latitude
end_longitude
field0
field1
10
SSP
0
NA
1
NA
10
SOUTH BAY
NA
NA
1992
10
10
NA
KRISTEN
ANTOINETTE
01-Oct-92
WALT DISNEY
1340
1355
15
6.40
EBB
NA
NA
NA
NA
SHOAL
SHELLS
TRUE
30
NA
NA
NA
NA
NA
NA
10
SSP
90
NA
1
NA
10
SOUTH BAY
NA
NA
1992
10
10
NA
KRISTEN
ANTOINETTE
01-Oct-92
WALT DISNEY
1340
1355
15
6.40
EBB
NA
NA
NA
NA
SHOAL
SHELLS
TRUE
30
NA
NA
NA
NA
NA
NA
10
SSP
56
NA
1
NA
10
SOUTH BAY
NA
NA
1992
10
10
NA
KRISTEN
ANTOINETTE
01-Oct-92
WALT DISNEY
1340
1355
15
6.40
EBB
NA
NA
NA
NA
SHOAL
SHELLS
TRUE
30
NA
NA
NA
NA
NA
NA
10
NA
NA
NA
15
NA
10
SOUTH BAY
NA
NA
1992
10
10
NA
KRISTEN
ANTOINETTE
01-Oct-92
WALT DISNEY
1340
1355
15
6.40
EBB
NA
NA
NA
NA
SHOAL
SHELLS
TRUE
30
NA
NA
NA
NA
NA
NA
10
CH
NA
NA
4
NA
10
SOUTH BAY
NA
NA
1992
10
10
NA
KRISTEN
ANTOINETTE
01-Oct-92
WALT DISNEY
1340
1355
15
6.40
EBB
NA
NA
NA
NA
SHOAL
SHELLS
TRUE
30
NA
NA
NA
NA
NA
NA
10
BS
480
NA
1
F
10
SOUTH BAY
NA
NA
1992
10
10
NA
KRISTEN
ANTOINETTE
01-Oct-92
WALT DISNEY
1340
1355
15
6.40
EBB
NA
NA
NA
NA
SHOAL
SHELLS
TRUE
30
NA
NA
NA
NA
NA
NA
10
BS
370
NA
1
M
10
SOUTH BAY
NA
NA
1992
10
10
NA
KRISTEN
ANTOINETTE
01-Oct-92
WALT DISNEY
1340
1355
15
6.40
EBB
NA
NA
NA
NA
SHOAL
SHELLS
TRUE
30
NA
NA
NA
NA
NA
NA
10
PMS
NA
NA
4
NA
10
SOUTH BAY
NA
NA
1992
10
10
NA
KRISTEN
ANTOINETTE
01-Oct-92
WALT DISNEY
1340
1355
15
6.40
EBB
NA
NA
NA
NA
SHOAL
SHELLS
TRUE
30
NA
NA
NA
NA
NA
NA
10
SSP
NA
NA
2
NA
10
SOUTH BAY
NA
NA
1992
10
10
NA
KRISTEN
ANTOINETTE
01-Oct-92
WALT DISNEY
1340
1355
15
6.40
EBB
NA
NA
NA
NA
SHOAL
SHELLS
TRUE
30
NA
NA
NA
NA
NA
NA
10
LS
460
46
1
M
10
SOUTH BAY
NA
NA
1992
10
10
NA
KRISTEN
ANTOINETTE
01-Oct-92
WALT DISNEY
1340
1355
15
6.40
EBB
NA
NA
NA
NA
SHOAL
SHELLS
TRUE
30
NA
NA
NA
NA
NA
NA
10
BR
615
62
1
M
10
SOUTH BAY
NA
NA
1992
10
10
NA
KRISTEN
ANTOINETTE
01-Oct-92
WALT DISNEY
1340
1355
15
6.40
EBB
NA
NA
NA
NA
SHOAL
SHELLS
TRUE
30
NA
NA
NA
NA
NA
NA
11
NA
NA
NA
20
NA
11
SOUTH BAY
NA
NA
1992
10
11
NA
TANYA
ANTOINETTE
01-Oct-92
WALT DISNEY
1540
1555
15
6.40
NA
NA
NA
NA
NA
NA
NA
TRUE
NA
NA
NA
NA
NA
NA
NA
11
PMS
NA
NA
8
NA
11
SOUTH BAY
NA
NA
1992
10
11
NA
TANYA
ANTOINETTE
01-Oct-92
WALT DISNEY
1540
1555
15
6.40
NA
NA
NA
NA
NA
NA
NA
TRUE
NA
NA
NA
NA
NA
NA
NA
14
NA
NA
NA
2
NA
14
SOUTH BAY
NA
NA
1992
10
14
NA
RENAE
LISA MARIE
02-Oct-92
WALT DISNEY
1350
1405
15
3.00
FLOOD
1232
NA
NA
E
SHOAL
NA
TRUE
NA
NA
NA
NA
NA
NA
NA
14
CH
NA
NA
15
NA
14
SOUTH BAY
NA
NA
1992
10
14
NA
RENAE
LISA MARIE
02-Oct-92
WALT DISNEY
1350
1405
15
3.00
FLOOD
1232
NA
NA
E
SHOAL
NA
TRUE
NA
NA
NA
NA
NA
NA
NA
14
PMS
NA
NA
7
NA
14
SOUTH BAY
NA
NA
1992
10
14
NA
RENAE
LISA MARIE
02-Oct-92
WALT DISNEY
1350
1405
15
3.00
FLOOD
1232
NA
NA
E
SHOAL
NA
TRUE
NA
NA
NA
NA
NA
NA
NA
14
SSP
NA
NA
6
NA
14
SOUTH BAY
NA
NA
1992
10
14
NA
RENAE
LISA MARIE
02-Oct-92
WALT DISNEY
1350
1405
15
3.00
FLOOD
1232
NA
NA
E
SHOAL
NA
TRUE
NA
NA
NA
NA
NA
NA
NA
17
YG
NA
NA
2
NA
17
SOUTH BAY
NA
NA
1992
10
17
NA
EGP
LISA MARIE
02-Oct-92
WALT DISNEY
1445
1500
15
5.00
FLOOD
1232
NA
NA
I
SHOAL
NA
TRUE
30
NA
NA
NA
NA
NA
NA
17
BR
430
44
1
F
17
SOUTH BAY
NA
NA
1992
10
17
NA
EGP
LISA MARIE
02-Oct-92
WALT DISNEY
1445
1500
15
5.00
FLOOD
1232
NA
NA
I
SHOAL
NA
TRUE
30
NA
NA
NA
NA
NA
NA
17
CG
NA
NA
3
NA
17
SOUTH BAY
NA
NA
1992
10
17
NA
EGP
LISA MARIE
02-Oct-92
WALT DISNEY
1445
1500
15
5.00
FLOOD
1232
NA
NA
I
SHOAL
NA
TRUE
30
NA
NA
NA
NA
NA
NA
17
NA
NA
NA
31
NA
17
SOUTH BAY
NA
NA
1992
10
17
NA
EGP
LISA MARIE
02-Oct-92
WALT DISNEY
1445
1500
15
5.00
FLOOD
1232
NA
NA
I
SHOAL
NA
TRUE
30
NA
NA
NA
NA
NA
NA
17
CH
NA
NA
7
NA
17
SOUTH BAY
NA
NA
1992
10
17
NA
EGP
LISA MARIE
02-Oct-92
WALT DISNEY
1445
1500
15
5.00
FLOOD
1232
NA
NA
I
SHOAL
NA
TRUE
30
NA
NA
NA
NA
NA
NA
18
SSD
NA
NA
5
NA
18
SOUTH BAY
NA
NA
1992
10
18
NA
CAROL
LISA MARIE
02-Oct-92
WALT DISNEY
1540
1555
15
10.00
FLOOD
NA
NA
NA
J-5
CHANNEL
MUD
TRUE
30
NA
NA
NA
NA
NA
NA
18
CH
NA
NA
4
NA
18
SOUTH BAY
NA
NA
1992
10
18
NA
CAROL
LISA MARIE
02-Oct-92
WALT DISNEY
1540
1555
15
10.00
FLOOD
NA
NA
NA
J-5
CHANNEL
MUD
TRUE
30
NA
NA
NA
NA
NA
NA
18
YG
NA
NA
4
NA
18
SOUTH BAY
NA
NA
1992
10
18
NA
CAROL
LISA MARIE
02-Oct-92
WALT DISNEY
1540
1555
15
10.00
FLOOD
NA
NA
NA
J-5
CHANNEL
MUD
TRUE
30
NA
NA
NA
NA
NA
NA
18
NA
NA
NA
5
NA
18
SOUTH BAY
NA
NA
1992
10
18
NA
CAROL
LISA MARIE
02-Oct-92
WALT DISNEY
1540
1555
15
10.00
FLOOD
NA
NA
NA
J-5
CHANNEL
MUD
TRUE
30
NA
NA
NA
NA
NA
NA
18
PMS
NA
NA
40
NA
18
SOUTH BAY
NA
NA
1992
10
18
NA
CAROL
LISA MARIE
02-Oct-92
WALT DISNEY
1540
1555
15
10.00
FLOOD
NA
NA
NA
J-5
CHANNEL
MUD
TRUE
30
NA
NA
NA
NA
NA
NA
18
CG
NA
NA
4
NA
18
SOUTH BAY
NA
NA
1992
10
18
NA
CAROL
LISA MARIE
02-Oct-92
WALT DISNEY
1540
1555
15
10.00
FLOOD
NA
NA
NA
J-5
CHANNEL
MUD
TRUE
30
NA
NA
NA
NA
NA
NA
19
SSP
NA
NA
14
NA
19
SOUTH BAY
NA
NA
1992
10
19
2
CAROL
DAVE
03-Oct-92
TEACHER SEMINAR
859
915
16
5.67
EBB
822
NA
NA
C-2
SHOAL
NA
TRUE
30
NA
NA
NA
NA
NA
NA
19
SS
NA
NA
2
NA
19
SOUTH BAY
NA
NA
1992
10
19
2
CAROL
DAVE
03-Oct-92
TEACHER SEMINAR
859
915
16
5.67
EBB
822
NA
NA
C-2
SHOAL
NA
TRUE
30
NA
NA
NA
NA
NA
NA
19
DT
NA
NA
3
NA
19
SOUTH BAY
NA
NA
1992
10
19
2
CAROL
DAVE
03-Oct-92
TEACHER SEMINAR
859
915
16
5.67
EBB
822
NA
NA
C-2
SHOAL
NA
TRUE
30
NA
NA
NA
NA
NA
NA
19
CH
NA
NA
35
NA
19
SOUTH BAY
NA
NA
1992
10
19
2
CAROL
DAVE
03-Oct-92
TEACHER SEMINAR
859
915
16
5.67
EBB
822
NA
NA
C-2
SHOAL
NA
TRUE
30
NA
NA
NA
NA
NA
NA
19
PMS
NA
NA
60
NA
19
SOUTH BAY
NA
NA
1992
10
19
2
CAROL
DAVE
03-Oct-92
TEACHER SEMINAR
859
915
16
5.67
EBB
822
NA
NA
C-2
SHOAL
NA
TRUE
30
NA
NA
NA
NA
NA
NA
19
NA
NA
NA
101
NA
19
SOUTH BAY
NA
NA
1992
10
19
2
CAROL
DAVE
03-Oct-92
TEACHER SEMINAR
859
915
16
5.67
EBB
822
NA
NA
C-2
SHOAL
NA
TRUE
30
NA
NA
NA
NA
NA
NA
20
NA
NA
NA
750
NA
20
SOUTH BAY
NA
NA
1992
10
20
3
SUSAN
DAVE
03-Oct-92
TEACHER SEMINAR
945
1000
15
5.00
EBB
822
NA
NA
E
SHOAL
SHELLS
TRUE
30
NA
NA
NA
NA
NA
NA
20
CH
NA
NA
4
NA
20
SOUTH BAY
NA
NA
1992
10
20
3
SUSAN
DAVE
03-Oct-92
TEACHER SEMINAR
945
1000
15
5.00
EBB
822
NA
NA
E
SHOAL
SHELLS
TRUE
30
NA
NA
NA
NA
NA
NA
20
PMS
NA
NA
6
NA
20
SOUTH BAY
NA
NA
1992
10
20
3
SUSAN
DAVE
03-Oct-92
TEACHER SEMINAR
945
1000
15
5.00
EBB
822
NA
NA
E
SHOAL
SHELLS
TRUE
30
NA
NA
NA
NA
NA
NA
20
BG
NA
NA
3
NA
20
SOUTH BAY
NA
NA
1992
10
20
3
SUSAN
DAVE
03-Oct-92
TEACHER SEMINAR
945
1000
15
5.00
EBB
822
NA
NA
E
SHOAL
SHELLS
TRUE
30
NA
NA
NA
NA
NA
NA
20
BSP
NA
NA
3
NA
20
SOUTH BAY
NA
NA
1992
10
20
3
SUSAN
DAVE
03-Oct-92
TEACHER SEMINAR
945
1000
15
5.00
EBB
822
NA
NA
E
SHOAL
SHELLS
TRUE
30
NA
NA
NA
NA
NA
NA
20
SHS
NA
NA
2
NA
20
SOUTH BAY
NA
NA
1992
10
20
3
SUSAN
DAVE
03-Oct-92
TEACHER SEMINAR
945
1000
15
5.00
EBB
822
NA
NA
E
SHOAL
SHELLS
TRUE
30
NA
NA
NA
NA
NA
NA
20
SSP
NA
NA
10
NA
20
SOUTH BAY
NA
NA
1992
10
20
3
SUSAN
DAVE
03-Oct-92
TEACHER SEMINAR
945
1000
15
5.00
EBB
822
NA
NA
E
SHOAL
SHELLS
TRUE
30
NA
NA
NA
NA
NA
NA
21
NA
NA
NA
18
NA
21
SOUTH BAY
NA
NA
1992
10
21
4
LISA
DAVE
03-Oct-92
TEACHER SEMINAR
1035
1050
15
7.60
EBB
822
NA
NA
F
SHOAL
SHELLS
TRUE
30
NA
NA
NA
NA
NA
NA
21
SSP
NA
NA
10
NA
21
SOUTH BAY
NA
NA
1992
10
21
4
LISA
DAVE
03-Oct-92
TEACHER SEMINAR
1035
1050
15
7.60
EBB
822
NA
NA
F
SHOAL
SHELLS
TRUE
30
NA
NA
NA
NA
NA
NA
21
CG
NA
NA
18
NA
21
SOUTH BAY
NA
NA
1992
10
21
4
LISA
DAVE
03-Oct-92
TEACHER SEMINAR
1035
1050
15
7.60
EBB
822
NA
NA
F
SHOAL
SHELLS
TRUE
30
NA
NA
NA
NA
NA
NA
21
CH
NA
NA
8
NA
21
SOUTH BAY
NA
NA
1992
10
21
4
LISA
DAVE
03-Oct-92
TEACHER SEMINAR
1035
1050
15
7.60
EBB
822
NA
NA
F
SHOAL
SHELLS
TRUE
30
NA
NA
NA
NA
NA
NA
21
SHS
NA
NA
7
NA
21
SOUTH BAY
NA
NA
1992
10
21
4
LISA
DAVE
03-Oct-92
TEACHER SEMINAR
1035
1050
15
7.60
EBB
822
NA
NA
F
SHOAL
SHELLS
TRUE
30
NA
NA
NA
NA
NA
NA
21
PMS
NA
NA
3
NA
21
SOUTH BAY
NA
NA
1992
10
21
4
LISA
DAVE
03-Oct-92
TEACHER SEMINAR
1035
1050
15
7.60
EBB
822
NA
NA
F
SHOAL
SHELLS
TRUE
30
NA
NA
NA
NA
NA
NA
23
NA
NA
7
2
NA
23
SOUTH BAY
NA
NA
1992
10
23
NA
EGP
DAVE
05-Oct-92
BOLLINGER
840
857
17
NA
NA
NA
NA
NA
D-3
SHOAL
SHELLS
TRUE
66
NA
NA
NA
NA
NA
NA
23
SSP
NA
8
1
NA
23
SOUTH BAY
NA
NA
1992
10
23
NA
EGP
DAVE
05-Oct-92
BOLLINGER
840
857
17
NA
NA
NA
NA
NA
D-3
SHOAL
SHELLS
TRUE
66
NA
NA
NA
NA
NA
NA
23
CG
NA
7
2
NA
23
SOUTH BAY
NA
NA
1992
10
23
NA
EGP
DAVE
05-Oct-92
BOLLINGER
840
857
17
NA
NA
NA
NA
NA
D-3
SHOAL
SHELLS
TRUE
66
NA
NA
NA
NA
NA
NA
23
CG
NA
6
4
NA
23
SOUTH BAY
NA
NA
1992
10
23
NA
EGP
DAVE
05-Oct-92
BOLLINGER
840
857
17
NA
NA
NA
NA
NA
D-3
SHOAL
SHELLS
TRUE
66
NA
NA
NA
NA
NA
NA
23
CG
NA
5
10
NA
23
SOUTH BAY
NA
NA
1992
10
23
NA
EGP
DAVE
05-Oct-92
BOLLINGER
840
857
17
NA
NA
NA
NA
NA
D-3
SHOAL
SHELLS
TRUE
66
NA
NA
NA
NA
NA
NA
23
CG
NA
4
6
NA
23
SOUTH BAY
NA
NA
1992
10
23
NA
EGP
DAVE
05-Oct-92
BOLLINGER
840
857
17
NA
NA
NA
NA
NA
D-3
SHOAL
SHELLS
TRUE
66
NA
NA
NA
NA
NA
NA
23
SSD
NA
5
1
NA
23
SOUTH BAY
NA
NA
1992
10
23
NA
EGP
DAVE
05-Oct-92
BOLLINGER
840
857
17
NA
NA
NA
NA
NA
D-3
SHOAL
SHELLS
TRUE
66
NA
NA
NA
NA
NA
NA
23
SHS
NA
13
1
NA
23
SOUTH BAY
NA
NA
1992
10
23
NA
EGP
DAVE
05-Oct-92
BOLLINGER
840
857
17
NA
NA
NA
NA
NA
D-3
SHOAL
SHELLS
TRUE
66
NA
NA
NA
NA
NA
NA
23
CT
NA
18
1
NA
23
SOUTH BAY
NA
NA
1992
10
23
NA
EGP
DAVE
05-Oct-92
BOLLINGER
840
857
17
NA
NA
NA
NA
NA
D-3
SHOAL
SHELLS
TRUE
66
NA
NA
NA
NA
NA
NA
23
CH
NA
16
1
NA
23
SOUTH BAY
NA
NA
1992
10
23
NA
EGP
DAVE
05-Oct-92
BOLLINGER
840
857
17
NA
NA
NA
NA
NA
D-3
SHOAL
SHELLS
TRUE
66
NA
NA
NA
NA
NA
NA
23
DSP
NA
10
1
NA
23
SOUTH BAY
NA
NA
1992
10
23
NA
EGP
DAVE
05-Oct-92
BOLLINGER
840
857
17
NA
NA
NA
NA
NA
D-3
SHOAL
SHELLS
TRUE
66
NA
NA
NA
NA
NA
NA
23
CH
NA
24
1
NA
23
SOUTH BAY
NA
NA
1992
10
23
NA
EGP
DAVE
05-Oct-92
BOLLINGER
840
857
17
NA
NA
NA
NA
NA
D-3
SHOAL
SHELLS
TRUE
66
NA
NA
NA
NA
NA
NA
23
CH
NA
20
2
NA
23
SOUTH BAY
NA
NA
1992
10
23
NA
EGP
DAVE
05-Oct-92
BOLLINGER
840
857
17
NA
NA
NA
NA
NA
D-3
SHOAL
SHELLS
TRUE
66
NA
NA
NA
NA
NA
NA
25
CH
NA
21
1
NA
25
SOUTH BAY
NA
NA
1992
10
25
NA
TONY
DAVE
05-Oct-92
BOLLINGER
930
945
15
NA
NA
NA
NA
NA
B-1
SHOAL
NA
TRUE
NA
NA
NA
NA
NA
NA
NA
25
CG
NA
8
1
NA
25
SOUTH BAY
NA
NA
1992
10
25
NA
TONY
DAVE
05-Oct-92
BOLLINGER
930
945
15
NA
NA
NA
NA
NA
B-1
SHOAL
NA
TRUE
NA
NA
NA
NA
NA
NA
NA
25
CG
NA
7
2
NA
25
SOUTH BAY
NA
NA
1992
10
25
NA
TONY
DAVE
05-Oct-92
BOLLINGER
930
945
15
NA
NA
NA
NA
NA
B-1
SHOAL
NA
TRUE
NA
NA
NA
NA
NA
NA
NA
25
CG
NA
6
7
NA
25
SOUTH BAY
NA
NA
1992
10
25
NA
TONY
DAVE
05-Oct-92
BOLLINGER
930
945
15
NA
NA
NA
NA
NA
B-1
SHOAL
NA
TRUE
NA
NA
NA
NA
NA
NA
NA
25
CG
NA
5
16
NA
25
SOUTH BAY
NA
NA
1992
10
25
NA
TONY
DAVE
05-Oct-92
BOLLINGER
930
945
15
NA
NA
NA
NA
NA
B-1
SHOAL
NA
TRUE
NA
NA
NA
NA
NA
NA
NA
25
CG
NA
4
12
NA
25
SOUTH BAY
NA
NA
1992
10
25
NA
TONY
DAVE
05-Oct-92
BOLLINGER
930
945
15
NA
NA
NA
NA
NA
B-1
SHOAL
NA
TRUE
NA
NA
NA
NA
NA
NA
NA
25
CG
NA
3
1
NA
25
SOUTH BAY
NA
NA
1992
10
25
NA
TONY
DAVE
05-Oct-92
BOLLINGER
930
945
15
NA
NA
NA
NA
NA
B-1
SHOAL
NA
TRUE
NA
NA
NA
NA
NA
NA
NA
25
CH
NA
11
1
NA
25
SOUTH BAY
NA
NA
1992
10
25
NA
TONY
DAVE
05-Oct-92
BOLLINGER
930
945
15
NA
NA
NA
NA
NA
B-1
SHOAL
NA
TRUE
NA
NA
NA
NA
NA
NA
NA
25
CH
NA
12
2
NA
25
SOUTH BAY
NA
NA
1992
10
25
NA
TONY
DAVE
05-Oct-92
BOLLINGER
930
945
15
NA
NA
NA
NA
NA
B-1
SHOAL
NA
TRUE
NA
NA
NA
NA
NA
NA
NA
25
DSP
NA
8
2
NA
25
SOUTH BAY
NA
NA
1992
10
25
NA
TONY
DAVE
05-Oct-92
BOLLINGER
930
945
15
NA
NA
NA
NA
NA
B-1
SHOAL
NA
TRUE
NA
NA
NA
NA
NA
NA
NA
25
SHS
NA
12
1
NA
25
SOUTH BAY
NA
NA
1992
10
25
NA
TONY
DAVE
05-Oct-92
BOLLINGER
930
945
15
NA
NA
NA
NA
NA
B-1
SHOAL
NA
TRUE
NA
NA
NA
NA
NA
NA
NA
25
CH
NA
10
1
NA
25
SOUTH BAY
NA
NA
1992
10
25
NA
TONY
DAVE
05-Oct-92
BOLLINGER
930
945
15
NA
NA
NA
NA
NA
B-1
SHOAL
NA
TRUE
NA
NA
NA
NA
NA
NA
NA
26
CH
NA
18
1
NA
26
SOUTH BAY
NA
NA
1992
10
26
NA
CAROL
DAVE
05-Oct-92
BOLLINGER
1035
1050
15
NA
EBB
NA
NA
NA
D-3
SHOAL
SHELLS
TRUE
66
NA
NA
NA
NA
NA
NA
26
BSP
NA
10
1
NA
26
SOUTH BAY
NA
NA
1992
10
26
NA
CAROL
DAVE
05-Oct-92
BOLLINGER
1035
1050
15
NA
EBB
NA
NA
NA
D-3
SHOAL
SHELLS
TRUE
66
NA
NA
NA
NA
NA
NA
26
CG
NA
4
1
NA
26
SOUTH BAY
NA
NA
1992
10
26
NA
CAROL
DAVE
05-Oct-92
BOLLINGER
1035
1050
15
NA
EBB
NA
NA
NA
D-3
SHOAL
SHELLS
TRUE
66
NA
NA
NA
NA
NA
NA
26
PSD
NA
6
1
NA
26
SOUTH BAY
NA
NA
1992
10
26
NA
CAROL
DAVE
05-Oct-92
BOLLINGER
1035
1050
15
NA
EBB
NA
NA
NA
D-3
SHOAL
SHELLS
TRUE
66
NA
NA
NA
NA
NA
NA
26
CG
NA
7
1
NA
26
SOUTH BAY
NA
NA
1992
10
26
NA
CAROL
DAVE
05-Oct-92
BOLLINGER
1035
1050
15
NA
EBB
NA
NA
NA
D-3
SHOAL
SHELLS
TRUE
66
NA
NA
NA
NA
NA
NA
26
CG
NA
8
1
NA
26
SOUTH BAY
NA
NA
1992
10
26
NA
CAROL
DAVE
05-Oct-92
BOLLINGER
1035
1050
15
NA
EBB
NA
NA
NA
D-3
SHOAL
SHELLS
TRUE
66
NA
NA
NA
NA
NA
NA
28
NA
NA
6
16
NA
28
SOUTH BAY
NA
NA
1992
10
28
NA
EGP
EGP
06-Oct-92
NA
850
905
15
8.00
NA
NA
NA
NA
J-5
SHOAL
NA
TRUE
66
NA
NA
NA
NA
NA
NA
28
CG
NA
4
1
NA
28
SOUTH BAY
NA
NA
1992
10
28
NA
EGP
EGP
06-Oct-92
NA
850
905
15
8.00
NA
NA
NA
NA
J-5
SHOAL
NA
TRUE
66
NA
NA
NA
NA
NA
NA
28
BR
360
37
1
F
28
SOUTH BAY
NA
NA
1992
10
28
NA
EGP
EGP
06-Oct-92
NA
850
905
15
8.00
NA
NA
NA
NA
J-5
SHOAL
NA
TRUE
66
NA
NA
NA
NA
NA
NA
28
BR
500
51
1
M
28
SOUTH BAY
NA
NA
1992
10
28
NA
EGP
EGP
06-Oct-92
NA
850
905
15
8.00
NA
NA
NA
NA
J-5
SHOAL
NA
TRUE
66
NA
NA
NA
NA
NA
NA
28
BR
350
36
1
F
28
SOUTH BAY
NA
NA
1992
10
28
NA
EGP
EGP
06-Oct-92
NA
850
905
15
8.00
NA
NA
NA
NA
J-5
SHOAL
NA
TRUE
66
NA
NA
NA
NA
NA
NA
28
PMS
NA
5
2
NA
28
SOUTH BAY
NA
NA
1992
10
28
NA
EGP
EGP
06-Oct-92
NA
850
905
15
8.00
NA
NA
NA
NA
J-5
SHOAL
NA
TRUE
66
NA
NA
NA
NA
NA
NA
28
PMS
NA
6
1
NA
28
SOUTH BAY
NA
NA
1992
10
28
NA
EGP
EGP
06-Oct-92
NA
850
905
15
8.00
NA
NA
NA
NA
J-5
SHOAL
NA
TRUE
66
NA
NA
NA
NA
NA
NA
28
NA
NA
5
16
NA
28
SOUTH BAY
NA
NA
1992
10
28
NA
EGP
EGP
06-Oct-92
NA
850
905
15
8.00
NA
NA
NA
NA
J-5
SHOAL
NA
TRUE
66
NA
NA
NA
NA
NA
NA
28
NA
NA
7
15
NA
28
SOUTH BAY
NA
NA
1992
10
28
NA
EGP
EGP
06-Oct-92
NA
850
905
15
8.00
NA
NA
NA
NA
J-5
SHOAL
NA
TRUE
66
NA
NA
NA
NA
NA
NA
28
NA
NA
8
11
NA
28
SOUTH BAY
NA
NA
1992
10
28
NA
EGP
EGP
06-Oct-92
NA
850
905
15
8.00
NA
NA
NA
NA
J-5
SHOAL
NA
TRUE
66
NA
NA
NA
NA
NA
NA
28
NA
NA
9
6
NA
28
SOUTH BAY
NA
NA
1992
10
28
NA
EGP
EGP
06-Oct-92
NA
850
905
15
8.00
NA
NA
NA
NA
J-5
SHOAL
NA
TRUE
66
NA
NA
NA
NA
NA
NA
28
NA
NA
10
10
NA
28
SOUTH BAY
NA
NA
1992
10
28
NA
EGP
EGP
06-Oct-92
NA
850
905
15
8.00
NA
NA
NA
NA
J-5
SHOAL
NA
TRUE
66
NA
NA
NA
NA
NA
NA
28
SSP
NA
13
1
NA
28
SOUTH BAY
NA
NA
1992
10
28
NA
EGP
EGP
06-Oct-92
NA
850
905
15
8.00
NA
NA
NA
NA
J-5
SHOAL
NA
TRUE
66
NA
NA
NA
NA
NA
NA
28
CG
NA
6
1
NA
28
SOUTH BAY
NA
NA
1992
10
28
NA
EGP
EGP
06-Oct-92
NA
850
905
15
8.00
NA
NA
NA
NA
J-5
SHOAL
NA
TRUE
66
NA
NA
NA
NA
NA
NA
28
NA
NA
4
7
NA
28
SOUTH BAY
NA
NA
1992
10
28
NA
EGP
EGP
06-Oct-92
NA
850
905
15
8.00
NA
NA
NA
NA
J-5
SHOAL
NA
TRUE
66
NA
NA
NA
NA
NA
NA
28
CH
NA
23
1
NA
28
SOUTH BAY
NA
NA
1992
10
28
NA
EGP
EGP
06-Oct-92
NA
850
905
15
8.00
NA
NA
NA
NA
J-5
SHOAL
NA
TRUE
66
NA
NA
NA
NA
NA
NA
28
SSP
NA
10
2
NA
28
SOUTH BAY
NA
NA
1992
10
28
NA
EGP
EGP
06-Oct-92
NA
850
905
15
8.00
NA
NA
NA
NA
J-5
SHOAL
NA
TRUE
66
NA
NA
NA
NA
NA
NA
28
WC
NA
20
1
NA
28
SOUTH BAY
NA
NA
1992
10
28
NA
EGP
EGP
06-Oct-92
NA
850
905
15
8.00
NA
NA
NA
NA
J-5
SHOAL
NA
TRUE
66
NA
NA
NA
NA
NA
NA
28
BSP
NA
17
1
NA
28
SOUTH BAY
NA
NA
1992
10
28
NA
EGP
EGP
06-Oct-92
NA
850
905
15
8.00
NA
NA
NA
NA
J-5
SHOAL
NA
TRUE
66
NA
NA
NA
NA
NA
NA
28
CH
NA
21
3
NA
28
SOUTH BAY
NA
NA
1992
10
28
NA
EGP
EGP
06-Oct-92
NA
850
905
15
8.00
NA
NA
NA
NA
J-5
SHOAL
NA
TRUE
66
NA
NA
NA
NA
NA
NA
28
CH
NA
22
2
NA
28
SOUTH BAY
NA
NA
1992
10
28
NA
EGP
EGP
06-Oct-92
NA
850
905
15
8.00
NA
NA
NA
NA
J-5
SHOAL
NA
TRUE
66
NA
NA
NA
NA
NA
NA
28
CH
NA
18
1
NA
28
SOUTH BAY
NA
NA
1992
10
28
NA
EGP
EGP
06-Oct-92
NA
850
905
15
8.00
NA
NA
NA
NA
J-5
SHOAL
NA
TRUE
66
NA
NA
NA
NA
NA
NA
Preliminary analysis: Top Species
We want to display the top 10 species caught by quantity to see what species we are catching most
Code
top_10_catch <- catch_clean %>%left_join(species_key_clean,by ="species_code") %>%group_by(species_name) %>%summarise(total_catch =sum(number, na.rm =TRUE)) %>%arrange(desc(total_catch)) %>%slice_head(n =10) top_10_catch %>%rename('Species Name'= species_name,'Total Catch'= total_catch) %>%kable( format ="html", digits =3,caption ="Top 10 Species Caught in the SF Bay") %>%kable_styling(bootstrap_options =c("striped", "hover", "condensed", "responsive"),full_width =FALSE,position ="center",font_size =14 ) %>%row_spec(0, bold =TRUE, color ="white", background ="#A0185A") %>%# headerrow_spec(1:nrow(top_10_catch), color ="black", background ="#FFC4EB")
Top 10 Species Caught in the SF Bay
Species Name
Total Catch
Northern Anchovy
640618
Shiner Surfperch
128489
English Sole
84714
Staghorn Sculpin
27409
Pacific Herring
25755
Speckled Sanddab
15305
California Halibut
14069
Plainfin Midshipman
13662
Sanddab Sp.
13231
White Croaker
11443
In this analysis we will take the most abundant species, Northern Anchovy, and compare it with indicator species from the different regions of the bay.
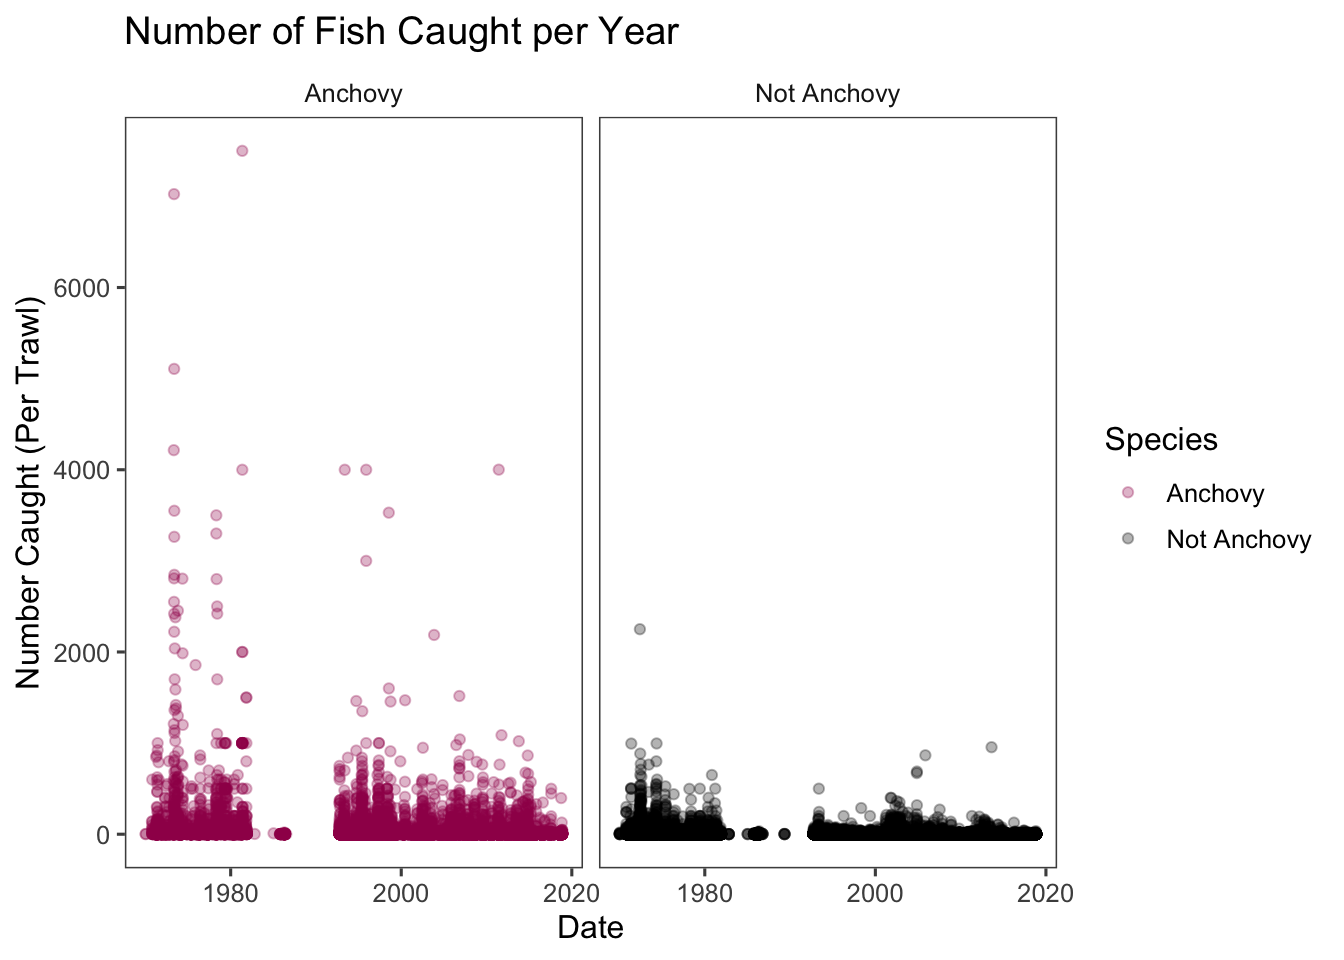
Here is a plot of the catch based on date with anchovies colored Pink as to get an idea of what the data looks like.
Code
library(patchwork)
Attaching package: 'patchwork'
The following object is masked from 'package:MASS':

    area
Code
catch_plot <- catch_clean %>%mutate(date =dmy(date)) catch_plot$species_group <-ifelse(catch_plot$species_code =="NA","Anchovy","Not Anchovy")ggplot(catch_plot, aes(x = date, y = number,color = species_group)) +geom_point(alpha = .3) + ggthemes::theme_few()+labs(x ="Date",y ="Number Caught (Per Trawl)",title ="Number of Fish Caught per Year",color ="Species") +scale_color_manual(values =c("Not Anchovy"="black","Anchovy"="#A0185A"))+facet_wrap(~species_group)
In this plot we can see that we catch Anchovies at a much higher quantity per trawl as well as over time. The bottom plots show a smaller date range so we can see peaks in Anchovies that are not as apparent in other species. There are some sampling gaps that become apparent in 1984 as well as 1988, with much fewer observations in general in the 80’s. This may result in less representative data.
Preliminary analysis: Indicator species
Indicator species:
reflect the biotic or abiotic state of the environment;
provide evidence for the impacts of environmental change; or
predict the diversity of other species, taxa or communities within a area group
By comparing Anchovy population to that of indicator species, it may shed light on whether Anchovy population can be representative of the indicator. We will be performing analyses on the four locales apparent in the bay as the indicator analysis is predicated on the fact the indicator species indicates the area group it is in.
To perform the indicator species analysis we will be using the function multipatt from the package indispecies. The function takes a group vector and a species matrix
Now we can run the function multipatt to find indicator species values for our groups
Code
indval <-multipatt(species_matrix, group_vector, control =how(nperm=999))
Code
summary(indval, alpha = .1)
 Multilevel pattern analysis
 ---------------------------

 Association function: IndVal.g
 Significance level (alpha): 0.1

 Total number of species: 162
 Selected number of species: 50
 Number of species associated to 1 group: 33
 Number of species associated to 2 groups: 12
 Number of species associated to 3 groups: 5

 List of species associated to each combination:

 Group CENTRAL BAY  #sps.  13
     stat p.value
SSD 0.456   0.009 **
CLF 0.217   0.039 *
POM 0.110   0.027 *
ps  0.066   0.051 .
HH  0.065   0.065 .
CRL 0.065   0.073 .
OP  0.059   0.046 *
JM  0.059   0.037 *
BSC 0.050   0.045 *
es  0.046   0.086 .
IRL 0.042   0.032 *
ssd 0.042   0.025 *
PB  0.039   0.090 .

 Group SAN PABLO BAY  #sps.  4
     stat p.value
BR  0.449   0.012 *
DT  0.328   0.048 *
TS  0.277   0.025 *
BSK 0.214   0.053 .

 Group SOUTH BAY  #sps.  2
     stat p.value
CT  0.308   0.072 .
DSP 0.285   0.091 .

 Group SUISUN BAY  #sps.  14
     stat p.value
SB  0.880   0.001 ***
SF  0.768   0.001 ***
TFS 0.417   0.001 ***
SST 0.303   0.001 ***
DLS 0.204   0.007 **
BDG 0.204   0.005 **
TP  0.148   0.017 *
CC  0.129   0.004 **
BLP 0.129   0.005 **
CK  0.091   0.013 *
KS  0.091   0.020 *
DS  0.089   0.016 *
BBC 0.088   0.017 *
PL  0.086   0.053 .

 Group CENTRAL BAY+SAN PABLO BAY  #sps.  6
     stat p.value
PMS 0.652   0.001 ***
PH  0.535   0.002 **
BG  0.495   0.001 ***
BPF 0.338   0.015 *
WSP 0.320   0.012 *
BHS 0.225   0.069 .

 Group CENTRAL BAY+SOUTH BAY  #sps.  1
    stat p.value
SD 0.381   0.039 *

 Group CENTRAL BAY+SUISUN BAY  #sps.  1
    stat p.value
PS 0.267   0.053 .

 Group SAN PABLO BAY+SOUTH BAY  #sps.  1
    stat p.value
BS 0.343   0.048 *

 Group SAN PABLO BAY+SUISUN BAY  #sps.  2
     stat p.value
YG  0.574   0.001 ***
LFS 0.538   0.001 ***

 Group SOUTH BAY+SUISUN BAY  #sps.  1
   stat p.value
UG 0.32    0.07 .

 Group CENTRAL BAY+SAN PABLO BAY+SOUTH BAY  #sps.  3
     stat p.value
NA  0.811   0.001 ***
SSP 0.762   0.003 **
WC  0.385   0.034 *

 Group CENTRAL BAY+SAN PABLO BAY+SUISUN BAY  #sps.  1
     stat p.value
PSD 0.527   0.001 ***

 Group SAN PABLO BAY+SOUTH BAY+SUISUN BAY  #sps.  1
    stat p.value
LS 0.353   0.028 *
---
Signif. codes:  0 '***' 0.001 '**' 0.01 '*' 0.05 '.' 0.1 ' ' 1
The output of that looks pretty bad, and the function does not let you pull out different pieces without the P-values changing so I made this reference table of the top 2 species in each singular group.
Code
ind_table <-data.frame(Species =c("SSD", "CLF", # CENTRAL BAY top 2"BR", "DT", # SAN PABLO BAY top 2"CT", "DSP", # SOUTH BAY top 2"SB", "SF"# SUISUN BAY top 2 ),Group =c(rep("CENTRAL BAY", 2),rep("SAN PABLO BAY", 2),rep("SOUTH BAY", 2),rep("SUISUN BAY", 2) ),Stat =c(0.456, 0.217, # CENTRAL BAY0.449, 0.328, # SAN PABLO BAY0.308, 0.285, # SOUTH BAY0.880, 0.768# SUISUN BAY ),'P_Value'=c(0.008, 0.044, # CENTRAL BAY0.009, 0.051, # SAN PABLO BAY0.072, 0.077, # SOUTH BAY0.001, 0.001# SUISUN BAY )) ind_table %>%kable( format ="html", digits =3,caption ="Top 2 indicator species in each region ") %>%kable_styling(bootstrap_options =c("striped", "hover", "condensed", "responsive"),full_width =FALSE,position ="center",font_size =14 ) %>%row_spec(0, bold =TRUE, color ="white", background ="#A0185A") %>%# headerrow_spec(1:nrow(ind_table), color ="black", background ="#FFC4EB") %>%scroll_box(width ="300px", height ="400px")
Top 2 indicator species in each region
Species
Group
Stat
P_Value
SSD
CENTRAL BAY
0.456
0.008
CLF
CENTRAL BAY
0.217
0.044
BR
SAN PABLO BAY
0.449
0.009
DT
SAN PABLO BAY
0.328
0.051
CT
SOUTH BAY
0.308
0.072
DSP
SOUTH BAY
0.285
0.077
SB
SUISUN BAY
0.880
0.001
SF
SUISUN BAY
0.768
0.001
From the summary we can see that the top species for the four San Francisco Bay locales are:
Group CENTRAL BAY SSD: Speckled Sanddab
Group SAN PABLO BAY BR: Bat Ray
Group SOUTH BAY CT: California Tonguefish
Group SUISUN BAY SB: Striped Bass
Next we are going to compare Northern Anchovy catches to these species using a hurdle model
Hurdle model and create function
Hurdle Models are a class of models for count data that help handle excess zeros and over dispersion, which fits our data nicely. It handles these by treating presence as a binary operator (present vs not present) and running a binomial(link = ‘logit’) model. The model also includes abundance, which analyzes count data using a negative binomial model.
Now speckled is encoded with our model summaries, predictions, and plot. For this I will show all outputs, in later chunks I will bypass showing predictions
Model Summary
Code
speckled$summary_table
Joint Model Output: Presence vs Abundance
Model
Term
Estimate
SE
Test Stat
P-Value
Presence (Logit)
(Intercept)
-1.556
0.031
-49.769
0.000
Presence (Logit)
northern_anchovy_z
-0.531
0.087
-6.127
0.000
Presence (Logit)
in_regionTRUE
1.089
0.081
13.490
0.000
Presence (Logit)
northern_anchovy_z:in_regionTRUE
0.160
0.172
0.931
0.352
Abundance (NegBin)
(Intercept)
1.965
0.033
59.284
0.000
Abundance (NegBin)
northern_anchovy_z
-0.058
0.053
-1.082
0.279
Abundance (NegBin)
in_regionTRUE
0.816
0.077
10.546
0.000
Abundance (NegBin)
northern_anchovy_z:in_regionTRUE
-0.101
0.145
-0.696
0.487
Coefficient discussion
Each coefficient table will have 8 estimates and p-values. The first 4 refer to the Presence (logit) model, the second 4 refer to the Abundance (negbin) model. Each of the models have the same structure as well: intercept, northern_anchovy_z, in_regionTRUE, and northern_anchovy_z:in_regionTRUE. The intercept is set at the level in_regionFalse, meaning its the outcome of not being in the indicators region, and not having Anchovies present. Northern_anchovy_z estimate and p_value show the effect on Northern_anchovy_z outside the region. In_regionTRUE estimate and p_value show the effect of being in the the region on the indicator Presence and Abundance. Lastly northern_anchovy_z:in_regionTRUE shows the interaction between northern anchovies and being inside an indicators region.
Presence Prediction
Code
speckled$pred_pres_table
Presence Predictions
in_region
northern_anchovy_z
fit_link
se
pred_tbs
lower
upper
TRUE
-0.273
-0.367
0.083
0.409
0.371
0.449
TRUE
0.727
-0.737
0.134
0.324
0.269
0.384
TRUE
1.727
-1.107
0.271
0.248
0.163
0.360
TRUE
2.727
-1.477
0.417
0.186
0.092
0.341
TRUE
3.727
-1.847
0.564
0.136
0.050
0.323
TRUE
4.727
-2.217
0.712
0.098
0.026
0.305
TRUE
5.727
-2.587
0.860
0.070
0.014
0.289
TRUE
6.727
-2.958
1.009
0.049
0.007
0.273
TRUE
7.727
-3.328
1.157
0.035
0.004
0.257
TRUE
8.727
-3.698
1.306
0.024
0.002
0.243
TRUE
9.727
-4.068
1.455
0.017
0.001
0.228
TRUE
10.727
-4.438
1.603
0.012
0.001
0.215
TRUE
11.727
-4.808
1.752
0.008
0.000
0.202
TRUE
12.727
-5.178
1.901
0.006
0.000
0.190
TRUE
13.727
-5.549
2.050
0.004
0.000
0.178
TRUE
14.727
-5.919
2.199
0.003
0.000
0.167
TRUE
15.727
-6.289
2.348
0.002
0.000
0.156
TRUE
16.727
-6.659
2.497
0.001
0.000
0.146
TRUE
17.727
-7.029
2.645
0.001
0.000
0.137
TRUE
18.727
-7.399
2.794
0.001
0.000
0.128
TRUE
19.727
-7.770
2.943
0.000
0.000
0.119
TRUE
20.727
-8.140
3.092
0.000
0.000
0.111
TRUE
21.727
-8.510
3.241
0.000
0.000
0.104
TRUE
22.727
-8.880
3.390
0.000
0.000
0.097
TRUE
23.727
-9.250
3.539
0.000
0.000
0.090
TRUE
24.727
-9.620
3.688
0.000
0.000
0.084
TRUE
25.727
-9.990
3.837
0.000
0.000
0.078
TRUE
26.727
-10.361
3.986
0.000
0.000
0.073
TRUE
27.727
-10.731
4.135
0.000
0.000
0.067
FALSE
-0.273
-1.412
0.032
0.196
0.186
0.206
FALSE
0.727
-1.942
0.080
0.125
0.109
0.144
FALSE
1.727
-2.473
0.164
0.078
0.058
0.104
FALSE
2.727
-3.004
0.249
0.047
0.030
0.075
FALSE
3.727
-3.534
0.336
0.028
0.015
0.053
FALSE
4.727
-4.065
0.422
0.017
0.007
0.038
FALSE
5.727
-4.595
0.508
0.010
0.004
0.027
FALSE
6.727
-5.126
0.595
0.006
0.002
0.019
FALSE
7.727
-5.657
0.681
0.003
0.001
0.013
FALSE
8.727
-6.187
0.768
0.002
0.000
0.009
FALSE
9.727
-6.718
0.854
0.001
0.000
0.006
FALSE
10.727
-7.248
0.941
0.001
0.000
0.004
FALSE
11.727
-7.779
1.028
0.000
0.000
0.003
FALSE
12.727
-8.310
1.114
0.000
0.000
0.002
FALSE
13.727
-8.840
1.201
0.000
0.000
0.002
FALSE
14.727
-9.371
1.287
0.000
0.000
0.001
FALSE
15.727
-9.901
1.374
0.000
0.000
0.001
FALSE
16.727
-10.432
1.460
0.000
0.000
0.001
FALSE
17.727
-10.963
1.547
0.000
0.000
0.000
FALSE
18.727
-11.493
1.634
0.000
0.000
0.000
FALSE
19.727
-12.024
1.720
0.000
0.000
0.000
FALSE
20.727
-12.554
1.807
0.000
0.000
0.000
FALSE
21.727
-13.085
1.893
0.000
0.000
0.000
FALSE
22.727
-13.616
1.980
0.000
0.000
0.000
FALSE
23.727
-14.146
2.067
0.000
0.000
0.000
FALSE
24.727
-14.677
2.153
0.000
0.000
0.000
FALSE
25.727
-15.207
2.240
0.000
0.000
0.000
FALSE
26.727
-15.738
2.326
0.000
0.000
0.000
FALSE
27.727
-16.269
2.413
0.000
0.000
0.000
Abundance Prediction
Code
speckled$pred_abu_table
Abundance Predictions
in_region
northern_anchovy_z
fit_link
se
pred_tbs
lower
upper
TRUE
-0.273
2.825
0.076
16.854
14.533
19.545
TRUE
0.727
2.666
0.126
14.380
11.227
18.419
TRUE
1.727
2.507
0.250
12.270
7.512
20.043
TRUE
2.727
2.348
0.382
10.469
4.952
22.134
TRUE
3.727
2.190
0.515
8.933
3.253
24.531
TRUE
4.727
2.031
0.649
7.622
2.134
27.223
TRUE
5.727
1.872
0.784
6.504
1.399
30.231
TRUE
6.727
1.714
0.919
5.549
0.917
33.583
TRUE
7.727
1.555
1.053
4.735
0.601
37.316
TRUE
8.727
1.396
1.188
4.040
0.394
41.470
TRUE
9.727
1.238
1.323
3.447
0.258
46.091
TRUE
10.727
1.079
1.458
2.941
0.169
51.231
TRUE
11.727
0.920
1.593
2.510
0.111
56.947
TRUE
12.727
0.761
1.728
2.141
0.072
63.304
TRUE
13.727
0.603
1.863
1.827
0.047
70.373
TRUE
14.727
0.444
1.998
1.559
0.031
78.234
TRUE
15.727
0.285
2.133
1.330
0.020
86.974
TRUE
16.727
0.127
2.268
1.135
0.013
96.692
TRUE
17.727
-0.032
2.403
0.968
0.009
107.498
TRUE
18.727
-0.191
2.538
0.826
0.006
119.513
TRUE
19.727
-0.349
2.673
0.705
0.004
132.873
TRUE
20.727
-0.508
2.808
0.602
0.002
147.727
TRUE
21.727
-0.667
2.943
0.513
0.002
164.243
TRUE
22.727
-0.826
3.078
0.438
0.001
182.607
TRUE
23.727
-0.984
3.213
0.374
0.001
203.025
TRUE
24.727
-1.143
3.348
0.319
0.000
225.727
TRUE
25.727
-1.302
3.483
0.272
0.000
250.969
TRUE
26.727
-1.460
3.618
0.232
0.000
279.035
TRUE
27.727
-1.619
3.753
0.198
0.000
310.241
FALSE
-0.273
1.981
0.033
7.251
6.797
7.736
FALSE
0.727
1.923
0.056
6.845
6.127
7.646
FALSE
1.727
1.866
0.105
6.461
5.262
7.934
FALSE
2.727
1.808
0.156
6.099
4.490
8.286
FALSE
3.727
1.750
0.209
5.757
3.824
8.669
FALSE
4.727
1.693
0.262
5.435
3.255
9.075
FALSE
5.727
1.635
0.315
5.130
2.770
9.503
FALSE
6.727
1.577
0.368
4.843
2.356
9.954
FALSE
7.727
1.520
0.421
4.571
2.004
10.427
FALSE
8.727
1.462
0.474
4.315
1.705
10.924
FALSE
9.727
1.404
0.527
4.073
1.450
11.445
FALSE
10.727
1.347
0.580
3.845
1.233
11.991
FALSE
11.727
1.289
0.633
3.630
1.049
12.564
FALSE
12.727
1.231
0.687
3.426
0.892
13.164
FALSE
13.727
1.174
0.740
3.234
0.758
13.793
FALSE
14.727
1.116
0.793
3.053
0.645
14.453
FALSE
15.727
1.058
0.846
2.882
0.548
15.144
FALSE
16.727
1.001
0.900
2.721
0.466
15.868
FALSE
17.727
0.943
0.953
2.568
0.397
16.627
FALSE
18.727
0.885
1.006
2.424
0.337
17.423
FALSE
19.727
0.828
1.060
2.288
0.287
18.257
FALSE
20.727
0.770
1.113
2.160
0.244
19.131
FALSE
21.727
0.712
1.166
2.039
0.207
20.047
FALSE
22.727
0.655
1.219
1.925
0.176
21.006
FALSE
23.727
0.597
1.273
1.817
0.150
22.012
FALSE
24.727
0.539
1.326
1.715
0.128
23.066
FALSE
25.727
0.482
1.379
1.619
0.108
24.170
FALSE
26.727
0.424
1.433
1.528
0.092
25.328
FALSE
27.727
0.366
1.486
1.443
0.078
26.541
Combined Prediction
Code
speckled$combined_table
Expected Counts (Presence × Abundance)
in_region
northern_anchovy_z
fit_link
se
pred_tbs
lower
upper
expected_count
lower_expected
upper_expected
TRUE
-0.273
-0.367
0.083
0.409
0.371
0.449
6.900
5.387
8.780
TRUE
0.727
-0.737
0.134
0.324
0.269
0.384
4.655
3.019
7.070
TRUE
1.727
-1.107
0.271
0.248
0.163
0.360
3.049
1.222
7.217
TRUE
2.727
-1.477
0.417
0.186
0.092
0.341
1.946
0.454
7.540
TRUE
3.727
-1.847
0.564
0.136
0.050
0.323
1.217
0.161
7.913
TRUE
4.727
-2.217
0.712
0.098
0.026
0.305
0.749
0.056
8.311
TRUE
5.727
-2.587
0.860
0.070
0.014
0.289
0.455
0.019
8.727
TRUE
6.727
-2.958
1.009
0.049
0.007
0.273
0.274
0.007
9.159
TRUE
7.727
-3.328
1.157
0.035
0.004
0.257
0.164
0.002
9.604
TRUE
8.727
-3.698
1.306
0.024
0.002
0.243
0.098
0.001
10.061
TRUE
9.727
-4.068
1.455
0.017
0.001
0.228
0.058
0.000
10.530
TRUE
10.727
-4.438
1.603
0.012
0.001
0.215
0.034
0.000
11.010
TRUE
11.727
-4.808
1.752
0.008
0.000
0.202
0.020
0.000
11.501
TRUE
12.727
-5.178
1.901
0.006
0.000
0.190
0.012
0.000
12.004
TRUE
13.727
-5.549
2.050
0.004
0.000
0.178
0.007
0.000
12.517
TRUE
14.727
-5.919
2.199
0.003
0.000
0.167
0.004
0.000
13.041
TRUE
15.727
-6.289
2.348
0.002
0.000
0.156
0.002
0.000
13.576
TRUE
16.727
-6.659
2.497
0.001
0.000
0.146
0.001
0.000
14.122
TRUE
17.727
-7.029
2.645
0.001
0.000
0.137
0.001
0.000
14.680
TRUE
18.727
-7.399
2.794
0.001
0.000
0.128
0.001
0.000
15.248
TRUE
19.727
-7.770
2.943
0.000
0.000
0.119
0.000
0.000
15.828
TRUE
20.727
-8.140
3.092
0.000
0.000
0.111
0.000
0.000
16.420
TRUE
21.727
-8.510
3.241
0.000
0.000
0.104
0.000
0.000
17.024
TRUE
22.727
-8.880
3.390
0.000
0.000
0.097
0.000
0.000
17.640
TRUE
23.727
-9.250
3.539
0.000
0.000
0.090
0.000
0.000
18.269
TRUE
24.727
-9.620
3.688
0.000
0.000
0.084
0.000
0.000
18.912
TRUE
25.727
-9.990
3.837
0.000
0.000
0.078
0.000
0.000
19.567
TRUE
26.727
-10.361
3.986
0.000
0.000
0.073
0.000
0.000
20.237
TRUE
27.727
-10.731
4.135
0.000
0.000
0.067
0.000
0.000
20.922
FALSE
-0.273
-1.412
0.032
0.196
0.186
0.206
1.421
1.267
1.593
FALSE
0.727
-1.942
0.080
0.125
0.109
0.144
0.858
0.669
1.098
FALSE
1.727
-2.473
0.164
0.078
0.058
0.104
0.503
0.303
0.826
FALSE
2.727
-3.004
0.249
0.047
0.030
0.075
0.288
0.133
0.620
FALSE
3.727
-3.534
0.336
0.028
0.015
0.053
0.163
0.057
0.462
FALSE
4.727
-4.065
0.422
0.017
0.007
0.038
0.092
0.024
0.343
FALSE
5.727
-4.595
0.508
0.010
0.004
0.027
0.051
0.010
0.253
FALSE
6.727
-5.126
0.595
0.006
0.002
0.019
0.029
0.004
0.186
FALSE
7.727
-5.657
0.681
0.003
0.001
0.013
0.016
0.002
0.137
FALSE
8.727
-6.187
0.768
0.002
0.000
0.009
0.009
0.001
0.100
FALSE
9.727
-6.718
0.854
0.001
0.000
0.006
0.005
0.000
0.073
FALSE
10.727
-7.248
0.941
0.001
0.000
0.004
0.003
0.000
0.054
FALSE
11.727
-7.779
1.028
0.000
0.000
0.003
0.002
0.000
0.039
FALSE
12.727
-8.310
1.114
0.000
0.000
0.002
0.001
0.000
0.029
FALSE
13.727
-8.840
1.201
0.000
0.000
0.002
0.000
0.000
0.021
FALSE
14.727
-9.371
1.287
0.000
0.000
0.001
0.000
0.000
0.015
FALSE
15.727
-9.901
1.374
0.000
0.000
0.001
0.000
0.000
0.011
FALSE
16.727
-10.432
1.460
0.000
0.000
0.001
0.000
0.000
0.008
FALSE
17.727
-10.963
1.547
0.000
0.000
0.000
0.000
0.000
0.006
FALSE
18.727
-11.493
1.634
0.000
0.000
0.000
0.000
0.000
0.004
FALSE
19.727
-12.024
1.720
0.000
0.000
0.000
0.000
0.000
0.003
FALSE
20.727
-12.554
1.807
0.000
0.000
0.000
0.000
0.000
0.002
FALSE
21.727
-13.085
1.893
0.000
0.000
0.000
0.000
0.000
0.002
FALSE
22.727
-13.616
1.980
0.000
0.000
0.000
0.000
0.000
0.001
FALSE
23.727
-14.146
2.067
0.000
0.000
0.000
0.000
0.000
0.001
FALSE
24.727
-14.677
2.153
0.000
0.000
0.000
0.000
0.000
0.001
FALSE
25.727
-15.207
2.240
0.000
0.000
0.000
0.000
0.000
0.000
FALSE
26.727
-15.738
2.326
0.000
0.000
0.000
0.000
0.000
0.000
FALSE
27.727
-16.269
2.413
0.000
0.000
0.000
0.000
0.000
0.000
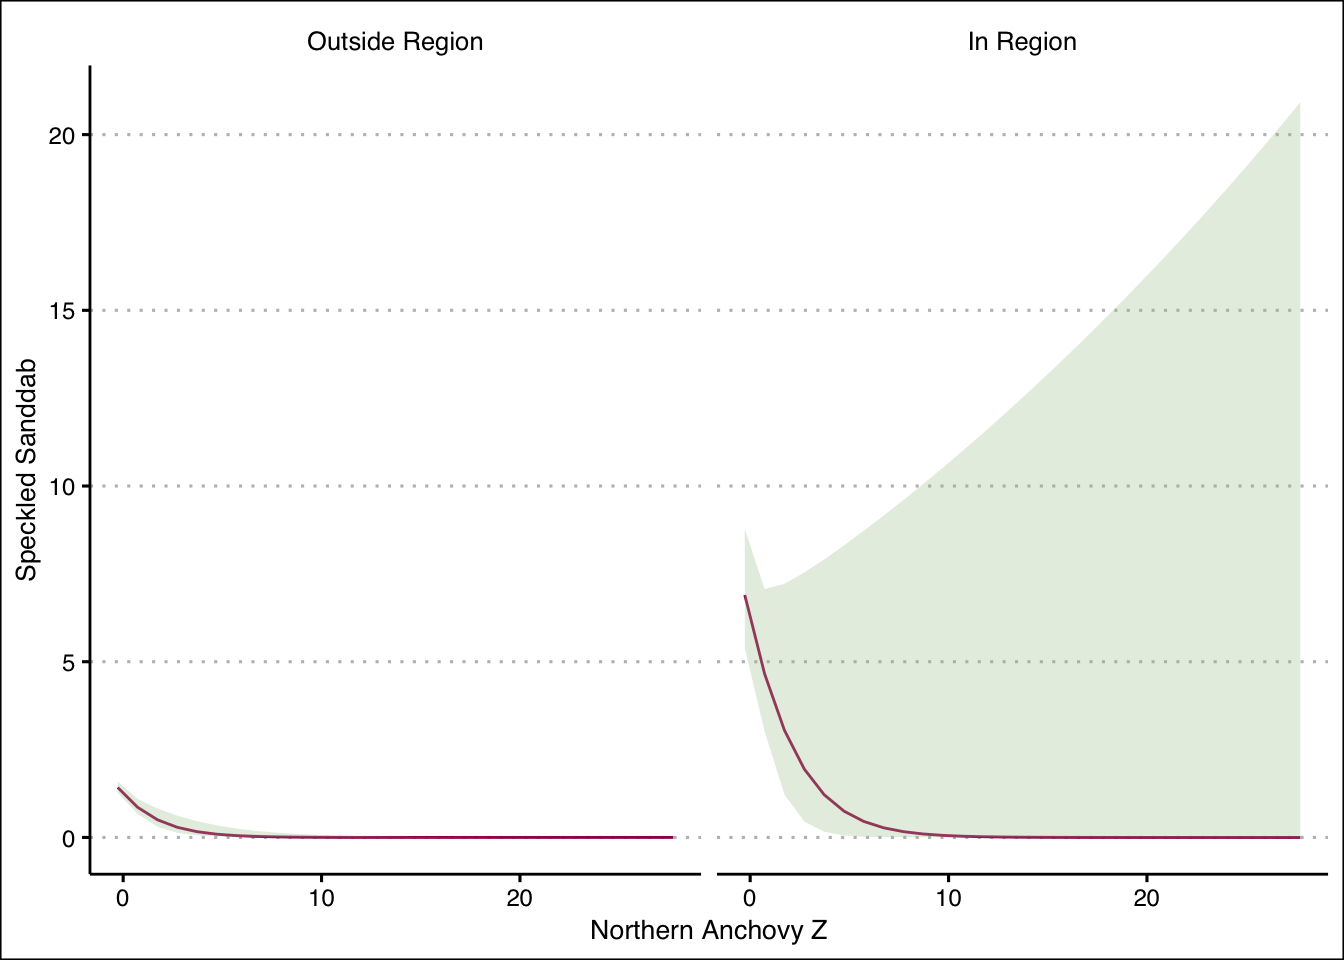
Speckled plot
Code
speckled$plot
Discussion: Speckled Sanddab
Based on the function we can see significance in presence of Anchovy and the region in both presence and abundance. This indicates that the presence of Anchovy comes at the cost of presence of Sanddabs. This model does not seem to fit incredibly well when looking at the plot, which can be seen by the flat lines and giant confidence intervals.
Function Call: San Pablo Bay
Code
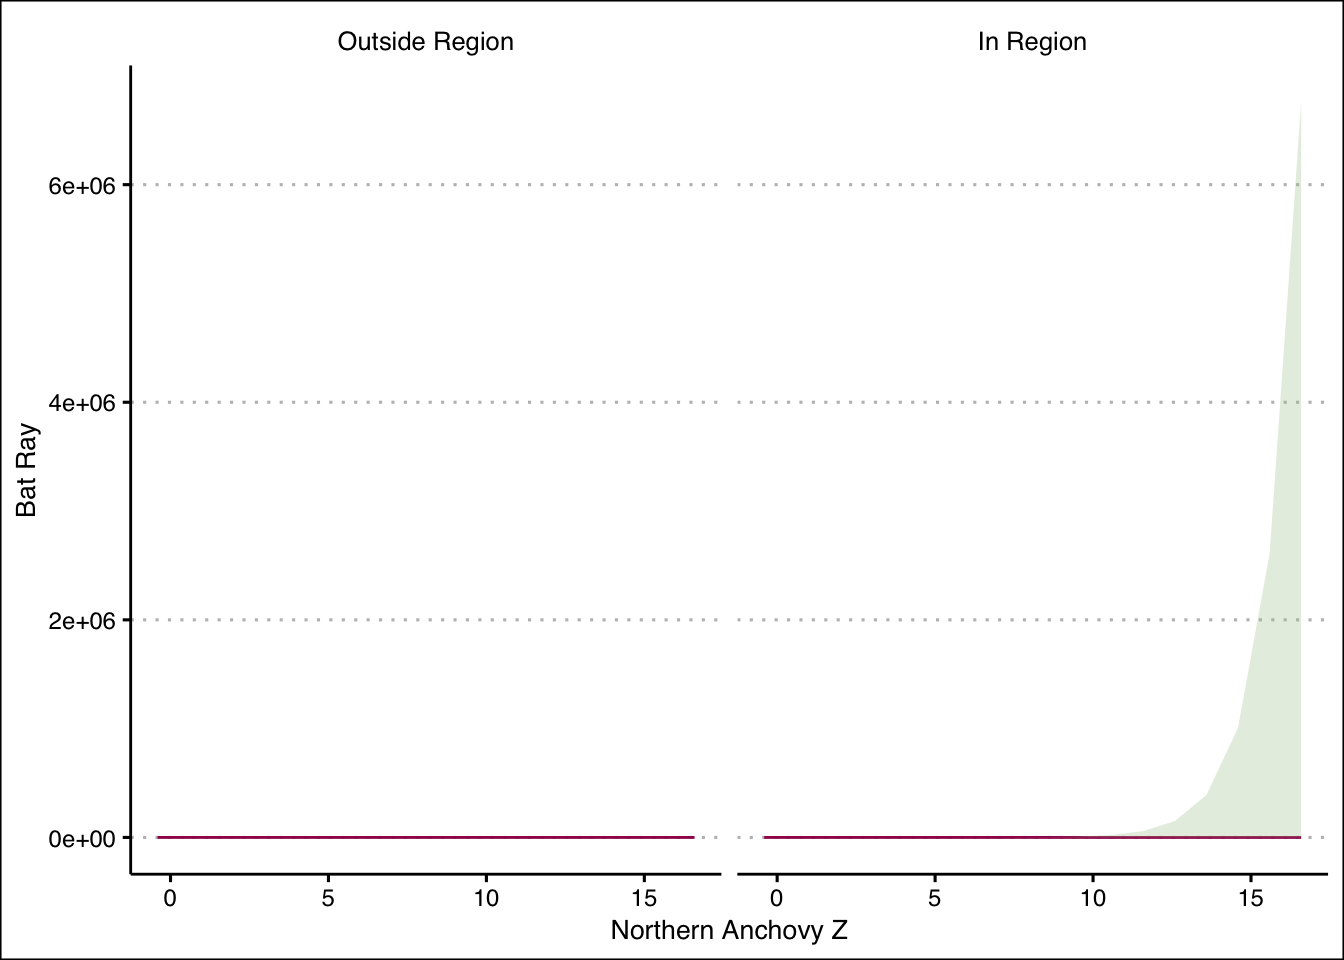
bat_ray <-predict_indicator(catch_clean, 'BR', 'SAN PABLO BAY')
Model Summary
Code
bat_ray$summary_table
Joint Model Output: Presence vs Abundance
Model
Term
Estimate
SE
Test Stat
P-Value
Presence (Logit)
(Intercept)
2.598
0.043
59.788
0.000
Presence (Logit)
northern_anchovy_z
-0.801
0.034
-23.834
0.000
Presence (Logit)
in_regionTRUE
-1.980
0.960
-2.063
0.039
Presence (Logit)
northern_anchovy_z:in_regionTRUE
1.476
0.932
1.584
0.113
Abundance (NegBin)
(Intercept)
4.321
0.018
236.057
0.000
Abundance (NegBin)
northern_anchovy_z
-0.223
0.022
-10.216
0.000
Abundance (NegBin)
in_regionTRUE
-3.409
0.917
-3.719
0.000
Abundance (NegBin)
northern_anchovy_z:in_regionTRUE
0.276
0.461
0.599
0.549
Bat Ray Plot
Code
bat_ray$plot
Discussion: Bat Ray
Based on the summary table, we can see significance of both presence and abundance in relation to Northern Anchovy. Interestingly the presence is barely insignificant while abundance is significant in region, indicating that this species is an indicator based more on abundance.
In my opinion this is the most interesting interaction. Presence in region, based on Northern Anchovy, and the interaction between the two are all significant. This is the only case in the analysis where any interaction is significant. When looking at abundance, both Anchovies and the interaction between them and in_region are minimally insignificant. When looking at the plot we see the best looking curve in the plot of within region. All this is super interesting in the context that in recent years there have been very few catches of Tonguefish, which indicates some sort of temporal skew.
Warning: glm.fit: fitted probabilities numerically 0 or 1 occurred
Warning in predict.lm(object, newdata, se.fit, scale = residual.scale, type =
if (type == : prediction from rank-deficient fit; attr(*, "non-estim") has
doubtful cases
Presence Summary
Code
bass$summary_table
Joint Model Output: Presence vs Abundance
Model
Term
Estimate
SE
Test Stat
P-Value
Presence (Logit)
(Intercept)
-3.647
0.121
-30.195
0.000
Presence (Logit)
northern_anchovy_z
-2.844
0.496
-5.735
0.000
Presence (Logit)
in_regionTRUE
-2499.678
183385.798
-0.014
0.989
Presence (Logit)
northern_anchovy_z:in_regionTRUE
-9032.834
657659.105
-0.014
0.989
Abundance (NegBin)
(Intercept)
0.330
0.093
3.553
0.000
Abundance (NegBin)
northern_anchovy_z
-0.521
0.333
-1.563
0.118
Abundance (NegBin)
in_regionTRUE
1.410
0.089
15.896
0.000
Bass Plot
Code
bass$plot
Discussion: Striped Bass
If Tonguefish was our best model, this would be our worst. When fitting the model we get the warning: prediction from rank-deficient fit; attr(*, “non-estim”) has doubtful cases. This indicates that the function is having trouble fitting the model to this data. This means that the summary and plot end up being generally unreliable. This was a big surprise to me as I expected Striped Bass to show an intense correlation, as they like less salty water when they pass through the bay (as infants and juveniles).
Final Discussion
Despite the effort, this analysis indicates that there is no real correlation between these indicator species and Northern Anchovy populations. In the future it may be possible to fit specific models to specific fish, and alter the models based on the fish species. Furthermore the integration of actual water quality variables such as temperature and salinity may yield more significance and representation within the data.